

How It Works
An overview of the Monthly Momentum trading system

The short version
Two models, Growth and Preserve, for different risk profiles. Each publish one trade signal a month: a target portfolio of low-cost index ETFs, and the buys and sells to reach it.
Our automated process consists of three major components:
The menu: This process decides among all the tradeable funds, which funds the model is permitted to choose.
The pipeline: the same handful of steps the model runs every month, calm markets or not. It decides how far to lean risk-on (into stocks) versus risk-off (into bonds and cash), then fills that posture with specific funds.
The regime responses: a small set of mechanisms that stay dormant and wake only when the market shifts into a particular state, each nudging that same risk-on / risk-off balance.
It is fully deterministic: same inputs, same trades, every time. No forecasts, no gut calls, no place for me or my dad to put a finger on the scale. Together, in backtests, those steps returned over 20% annualized returns since 2016 with much shallower losses in the big crises.
Below, we describe the process in detail.
The menu: what can we buy?
The process starts with an annual assessment of the universe and the menu. The universe consists of all the commission-free index ETFs available. Each January, the model rebuilds its menu from that universe, and our backtest is careful to use only the information that existed at the time. (A fund can’t show up in a 2010 menu if it didn’t exist until 2015, and a freshly launched fund has to build a real track record before it’s allowed in.) This is boring plumbing, and it’s also an easy place to accidentally cheat in a backtest by letting the test peek at the future. So we don’t.
The annual rebuild also throws out funds that are really the same bet wearing a different ticker, and screens out funds whose histories make them bad partners for a momentum strategy. What comes out the other end is a streamlined opportunity set, not a hand-picked list of last year’s winners.
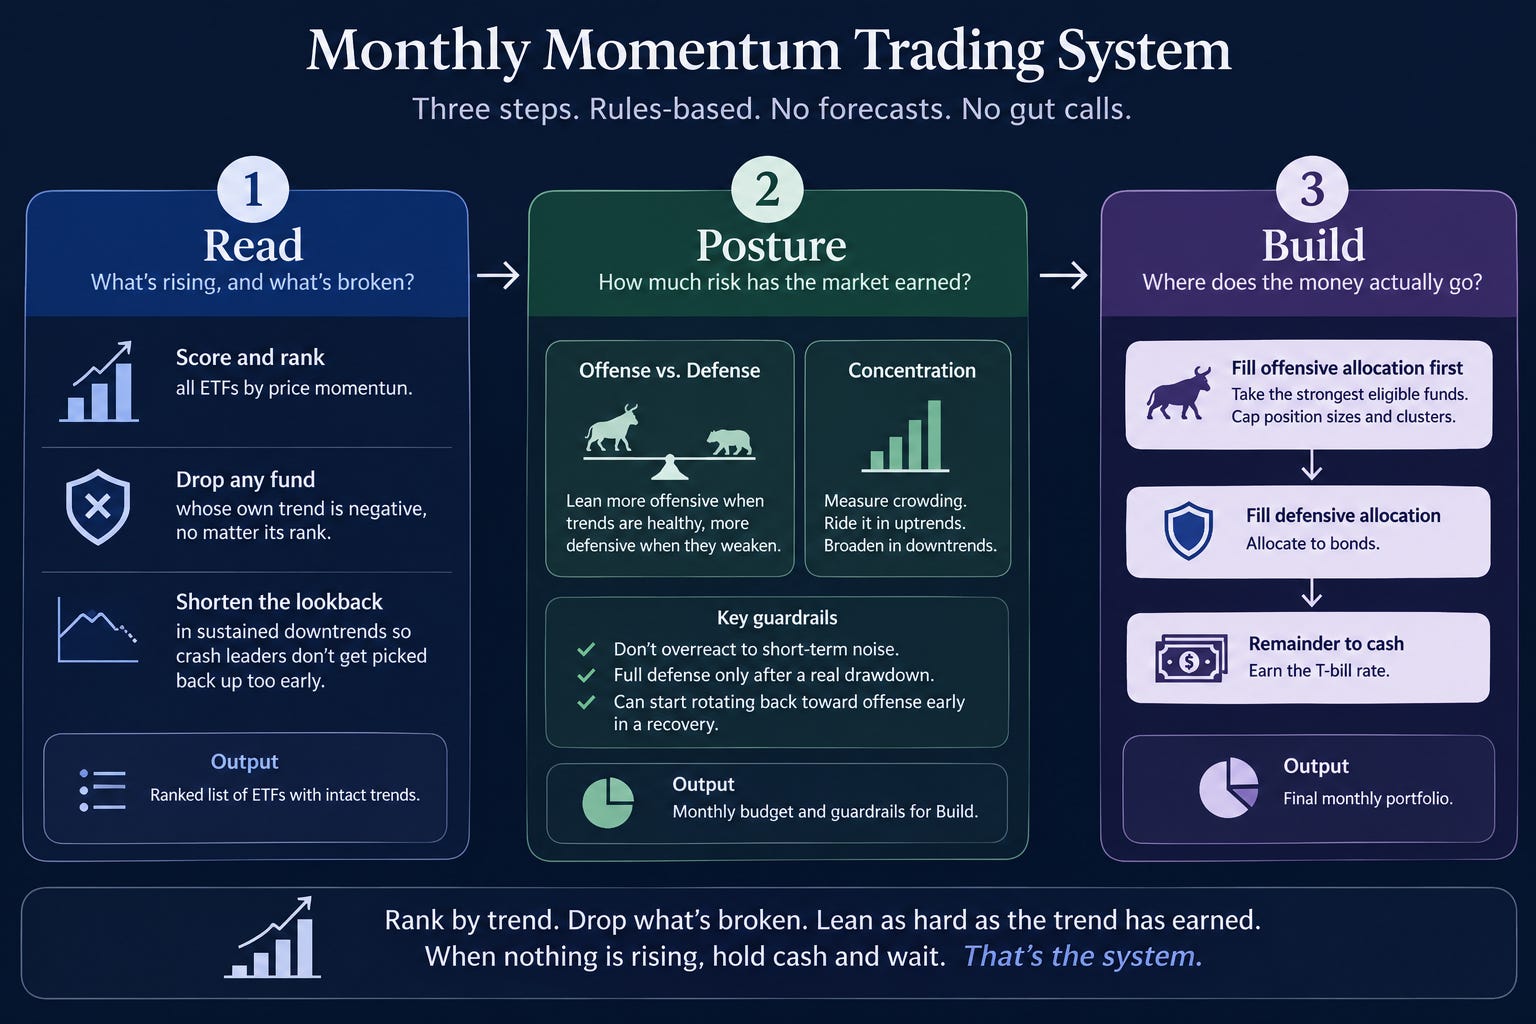
Once the menu is set, it’s left alone for the year and the monthly process takes over. Every month, we follow three steps to decide what to buy and what to sell.
The Pipeline
Step 1, Read: what’s rising, and what’s broken?
The model starts and ends with price. It does not read earnings calls, Fed tea leaves, headlines, or my opinions.
First, every fund on the menu is scored by price momentum (roughly, its trend over the past year) so every sector and asset class competes on one field. This gives us a stacked ranking of all the ETFs we can buy.
But a fund can still rank near the top of a weak field while its own trend has already rolled over; we don’t want that fund. So we then institute a short-term trend screen: if a fund’s own trend has turned negative, it’s out, no matter how its long-term trend looks against the alternatives. Relative strength tells you who the leaders are. The fund’s own trend tells you whether it’s worth holding at all. You need both.
There’s one subtle addition that emerged from my backtesting. The model normally reads momentum over a long horizon, because momentum is a slow signal. But in a sustained downturn it also shortens the horizon it measures momentum over, so the names that led going into the crash don’t get picked back up when the overall trend turns back up. This addition makes real money.
The output of the Read step is a ranked list of funds whose trends are still intact.
Step 2, Posture: how much risk has the market earned?
Before picking a single position, the model sets policy for the month along two axes: offense versus defense, and concentration.
Offense versus defense
The offensive side holds equities and other growth assets. The defensive side holds bonds, with cash sitting underneath both as the last resort. When offensive trends are healthy the model leans in; when they weaken it hands more room to defense. Incidentally, this is also what separates our two models: Growth can lean all the way offensive, while Preserve always keeps a defensive floor under the book. Same machine, one setting turned.
One thing we got wrong early was making it too responsive. A single bad week would flush the whole book into bonds. So the posture has some spine built in; it’s asymmetric. In a confirmed uptrend it caps how defensive it’s allowed to get on its own, and a fully defensive posture only unlocks after the market has taken a real drawdown, not a one-week scare. And early in a recovery it can start rotating back toward offense before the slower trend read has fully healed, so it isn’t the last one still hiding in bonds while everything climbs.
Concentration: Focus versus Breadth
Strong trends tend to get crowded, a handful of hot names carrying everything. My first instinct was to treat that as a sell signal. That instinct was wrong, and I can show you the backtest: selling every time the book looked crowded dumped the best trends way too early. But, under certain conditions, crowding can be a danger sign.
So the model treats crowding as a reading, not an order. It measures how much more volatile the offensive sleeve is running than the broad market, which is the fingerprint of a book piled into a few jumpy funds. What that reading means depends entirely on the trend. In a confirmed uptrend, crowding is usually just strong leadership worth riding, and the model keeps riding it. But if the trend is also broken, the same crowding reads as fragility, and the model forces the portfolio to broaden, so no single correlated cluster quietly becomes the entire bet. Same reading, opposite response, and the trend is the switch.
The Posture step picks no funds. It sets the budget and the guardrails that Build has to work with.
Step 3, Build: where does the money actually go?
Finally, the ranked survivors and the month’s posture are combined to build an actual portfolio.
The model fills the offensive allocation first, then the defensive one, with cash as the terminal rung. Within each sleeve it takes the strongest eligible funds and caps the size of any one holding, and any one correlated cluster, so the book can’t fold itself into a single theme.
In certain circumstances, the allocation is unable to fill a sleeve, and it’s worth understanding why, because the model responds to two very different reasons in two very different ways.
A portfolio limit blocked a position. A size cap is not a decision to get defensive, so the model just reaches for the next genuinely distinct fund on the same ranked list. The money stays offensive as long as there’s another real candidate for it.
The market read actually called for defense. Trends broke, posture shifted, and the unspent offensive budget rolls down to bonds. If bonds can’t absorb it either, the remainder sits in cash and earns the T-bill rate.
That ordered rolldown is what we call the ladder, and it’s doing something subtle: it keeps a mechanical position cap from masquerading as a defensive call, while still letting money flow to safety the moment the model has genuinely decided that risk no longer deserves it.
This is how a bear market rebuilds the book without anyone calling the bottom. Offensive funds fail their trend test one after another, the surviving menu shrinks, and capital walks down the ladder on its own. If bonds are falling too, as in 2022, cash becomes the answer by construction. Nobody predicted anything. The book just ran out of things that were still rising.
Regime Responses
Layered on top of the pipline are a few mechanisms that stay dormant until a specific market state wakes one, each adjusting the posture to keep the model’s shifts between risk-on and risk-off effective across a wide variety of market conditions: neither too jumpy nor too late.
Trend gating. The market’s own 200-day trend governs how much defense the model is even allowed to take. Above trend it stays fully risk-on; below it, defense unlocks only in proportion to how deep the decline runs.
Volatility discount. When the funds it holds run much more volatile than the market, the model treats their recent strength as a less reliable signal and discounts it — but it only steps into bonds when bonds are the thing actually trending up. That lets it sit through a scary-but-shallow dip yet still get defensive in a real, broad decline.
Volatility floor (Growth). When the market’s own volatility spikes, Growth holds a minimum cushion in bonds that grows with the turbulence — a backstop that engages in any violent selloff, whatever the model happens to be holding.
Recovery re-risk. Coming out of a decline, once the market turns back up off a low the model eases most of the defensive weight back into the leaders, to ride the recovery rather than sit in bonds through it.
Timing: don’t just do something, stand there
Finally, a point about timing.
We trade monthly, period. Read, Posture, Build run on the first trading day of each month. That’s the entire schedule, and the question I get most is: why don’t you trade more often?
Short answer: I tested every kind of faster, and faster lost. Momentum is a slow signal, and trading a slow signal quickly doesn’t make it smarter, it just makes the book flinch at every short-lived reversal and pay for the privilege.
For what it’s worth, I also tested triggers, and triggers lost too. I tried many different varieties of the “emergency trade signal” - triggered by volatility, by price movement, by inverted yield curves - none of it worked. What we won in one crisis we gave back, and then some, in calmer periods.
The trend giveth, and the trend taketh away. A momentum strategy must be late to a one-day crash, and I’ve made my peace with that; one-day crashes aren’t what wreck a retirement. Slow, grinding declines are, and that’s where a momentum strategy saves your nest egg.
What I threw out
Everything above is the residue of a long series of arguments: years of my dad refining this by hand, then many months of me (and Claude) trying to break it with modern backtesting and more compute than it probably needed. For every lever that made the cut, there’s a dozen or more that didn’t. Faster cadences, cleverer signals, concentration-as-sell, regime-timing overlays, all measured, all left on the floor. The simplicity you just read is the result, not the starting point, and I’m proud of what I was willing to discard. In backtests, our v5 models hold up across every regime back to 2006, including 2008.
The strategy underneath all of it, if you keep one sentence: rank by trend, drop what’s broken, concentrate as hard as the trend has earned, and when nothing is rising, hold cash and wait. Everything else is just minor adjustments.
Want more details?
Click over to the models page on our website for complete backtests to 2006, including the actual tickers, month-by-month performance numbers, and the signals we use for risk posture. We share it all, along with our live trade record, cryptographically signed for validation.
My dad and I trust our own savings to this strategy, and we’re sharing it because we believe we can help a lot of people enjoy a more comfortable retirement. Here’s hoping it helps you too.
This is very interesting. Up to what time period does the backtest run to? Thank you.